Surface
Contour Map
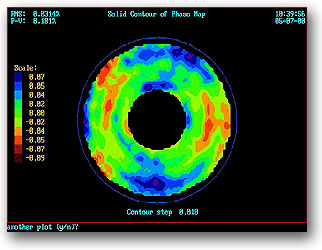
This map shows high and low areas
on 20" f 8 Ritchey-Chretien test mirror with a
total wavefront deviation of .18 waves peak-to-valley
and .031 waves r.m.s.
Fringe
Analysis Sheet
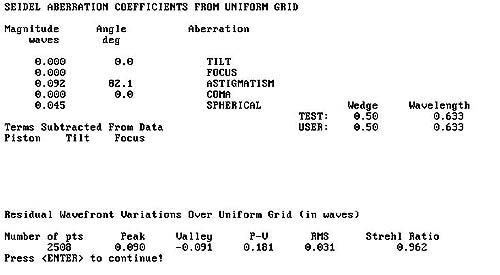
This document is a compilation of data averaged from
each interferogram. A minimum of three interferograms
is supplied with each optical system.
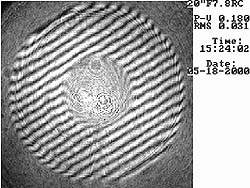
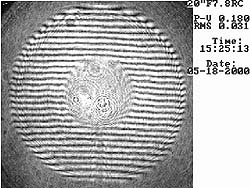
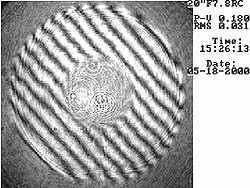
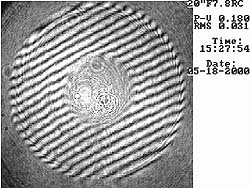
Interferograms
A CCD camera recording of an optical interference pattern
caused from laser light beam shearing between the incoming
and outgoing beam of the interferometer. The straighter
the lines, the better the optics.